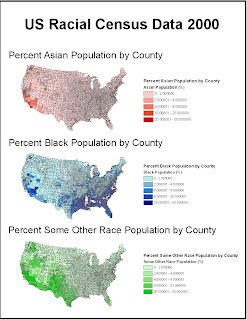
The distribution of Asian population is shown in red and reveals a heavy concentration in the West Coast. In further detail, it seems that the majority of Asians are located in Washington and California. In fact, the only counties that contain 20% or more Asians can only be found in these two states. Throughout the rest of the continental United States there is the occasional county that will contain 4% or more Asians in their population.
The distribution of Black population is shown in blue. The primary concentration of Blacks is in the South, in states like Texas, Louisiana, Georgia, and Florida. However, there are quite a few counties in California that have a Black population in the 8-20% range.
Lastly, the distribution of some other race is shown in green. This category accounts for people who consider themselves interracial or Hispanic/Latino. This group is primarily concentrated in the South Western region of the United States.
In conclusion, the racial analysis of reveals some interesting facts about how the United States’ population is distributed. These three graphs illustrate that the more “ethnic” counties are located along coast, with Blacks more towards the Southeast while both Asians and Others are more apparent in the West. It can thus be inferred that the population distribution in the middle and Northern regions of the continental US is dominated by Whites. Also to note is that, in comparison to Asians, Blacks and Others occupy more counties in higher concentrations. There are many more darkened Green and Blue counties than Red.
Geography is such a practical subject because it forms connections between other areas of study and the real world. GIS is a mechanism that can create these connections through a set of analytical tools. GIS allows users to perform your own analysis to suit the issue or problem at hand. The only setback of GIS, that I had noticed when dealing with GIS systems, is the preparation of data. It seems difficult to prepare raw data to be able to input it in GIS programs like ArcGIS. Aside from this last assignment, we never even touched base on the creation of shape files or data files. However, aside form this aspect of GIS, my impression of this subject is a positive one. It can show the environmental effects by delivering a map of the effect of the BP oil catastrophe or illustrate the wealth distribution within the United States. GIS reveals patterns in information that would otherwise be invisible. This is where the value of GIS comes from.